
기억보다 기록을
GGPLOT2 - geom_boxplot 사용하기 (상자 그림) 본문
library(ggplot2)

len = 20;

df<-data.frame(value=runif(len), category=c(rep("Category_1", len/4),
                                           rep("Category_2", len/4),
                                           rep("Category_3", len/4),
                                           rep("Category_4", len/4)))
기본적인 박스 플랏 그리기
ggplot(df, aes(category, value, color=category))+
  geom_boxplot()
물론 박스 내부 색상, 테두리 색상, 이상치 모양 등
여러가지 커스터마이징도 가능하다
ggplot(df, aes(category, value, color=category))+
  geom_boxplot(color="blue", #박스 테두리 색상
               fill="red", #박스 내부 색상
               width=0.25, #박스 너비
              outlier.size = 5, #이상치 크기
              outlier.shape = 1 #이상치의 모양 형태
              )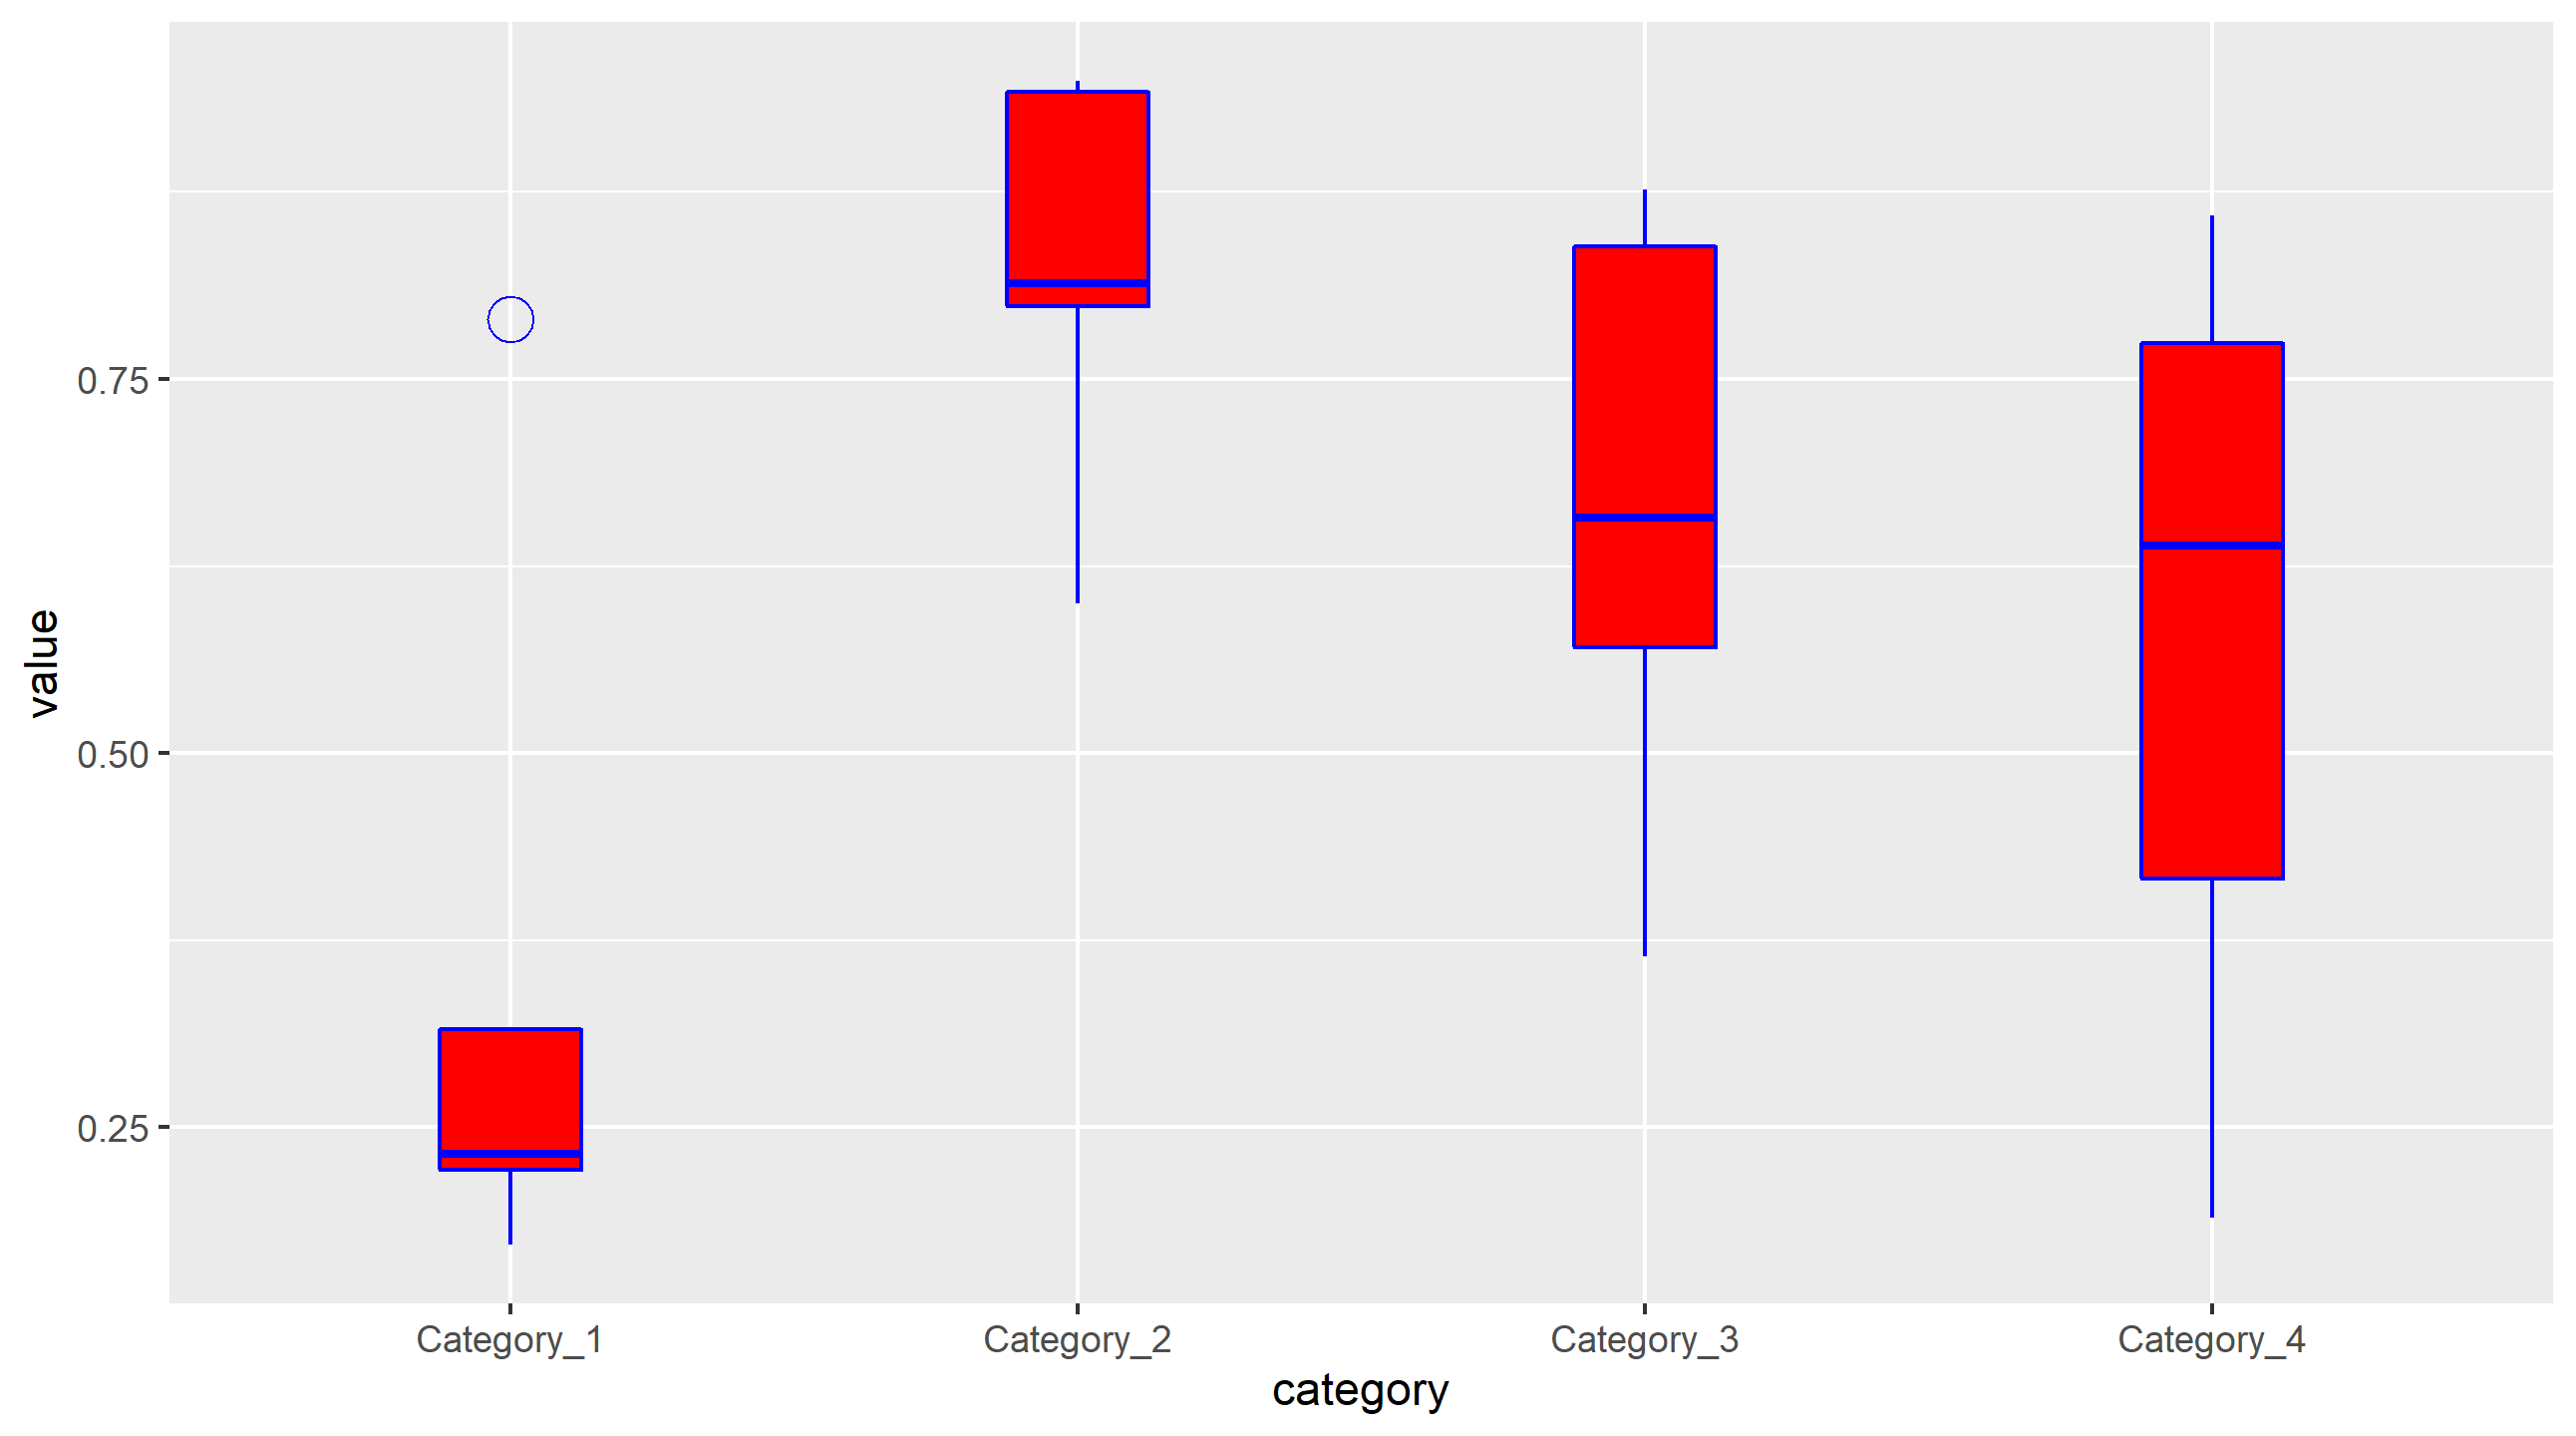
요렇게
'R' 카테고리의 다른 글
| GGPLOT2 - geom_map (한국 지도 그림 그리기) (0) | 2022.01.08 |
|---|---|
| GGPLOT2 - geom_histogram (히스토그램) (0) | 2022.01.06 |
| GGPLO2 - 그림 축, 제목, 태그 조절하기 (0) | 2021.12.27 |
| GGPLOT2 - Pie chart 만들기 (0) | 2021.12.27 |
| GGPLOT2 - geom_bar 사용하기 (막대그래프) (0) | 2021.12.17 |
'R' Related Articles
more


