R
GGPLOT2 - 합쳐진 그림에 대해 공통 범례 붙이기
쿠키아버님
2022. 2. 2. 04:13
grid.arrange를 사용하여 합쳐진 그림에 대해 공통 라벨을 붙이기
df<-data.frame(x = c(rep(1:5, 3)),
               y = runif(15),
               group = c(rep("Group1",5),
                         rep("Group2", 5),
                         rep("Group3", 5)))

g1<-ggplot(data=df)+
  geom_line(aes(x=x, y=y, group = group, color = group))

g2<-ggplot(data=df)+
  geom_line(aes(x=x, y=y^2, group = group, color = group))

g3<-ggplot(data=df)+
  geom_line(aes(x=x, y=y^3, group = group, color = group))

g<-grid.arrange(g1,g2,g3, nrow=3)

위 그림은 똑같은 범례가 3개나 있는데, 이들을 제거한 후 g라는 그림에 한개의 라벨을 붙이고자 한다.
get_only_legend라는 사용자 정의 함수를 만들어서 해결
절차는 다음과 같다.
1. get_only_legend 함수 정의
# function to extract legend from plot
get_only_legend <- function(plot) {
  plot_table <- ggplot_gtable(ggplot_build(plot))
  legend_plot <- which(sapply(plot_table$grobs, function(x) x$name) == "guide-box")
  legend <- plot_table$grobs[[legend_plot]]
  return(legend)
}
2. 기존 그림에 대해서는 범례 제거
g1<-ggplot(data=df)+
  geom_line(aes(x=x, y=y, group = group, color = group))+
  theme(legend.position="none")

g2<-ggplot(data=df)+
  geom_line(aes(x=x, y=y^2, group = group, color = group))+
  theme(legend.position="none")

g3<-ggplot(data=df)+
  geom_line(aes(x=x, y=y^3, group = group, color = group))+
  theme(legend.position="none")

g<-grid.arrange(g1, g2, g3, nrow=3)
3. 범례용 그림을 생성, get_only_legend 함수를 사용하여 범례만 추출
g_legend<-ggplot(data=df)+
  geom_line(aes(x=x, y=y, group = group, color = group))+
  theme(legend.position = "right")

CommonLegend<-get_only_legend(g_legend)
4. 기존 그림 (g)와 3에서 정의한 범례용 그림을 합치기
grid.arrange(g, CommonLegend, ncol=2)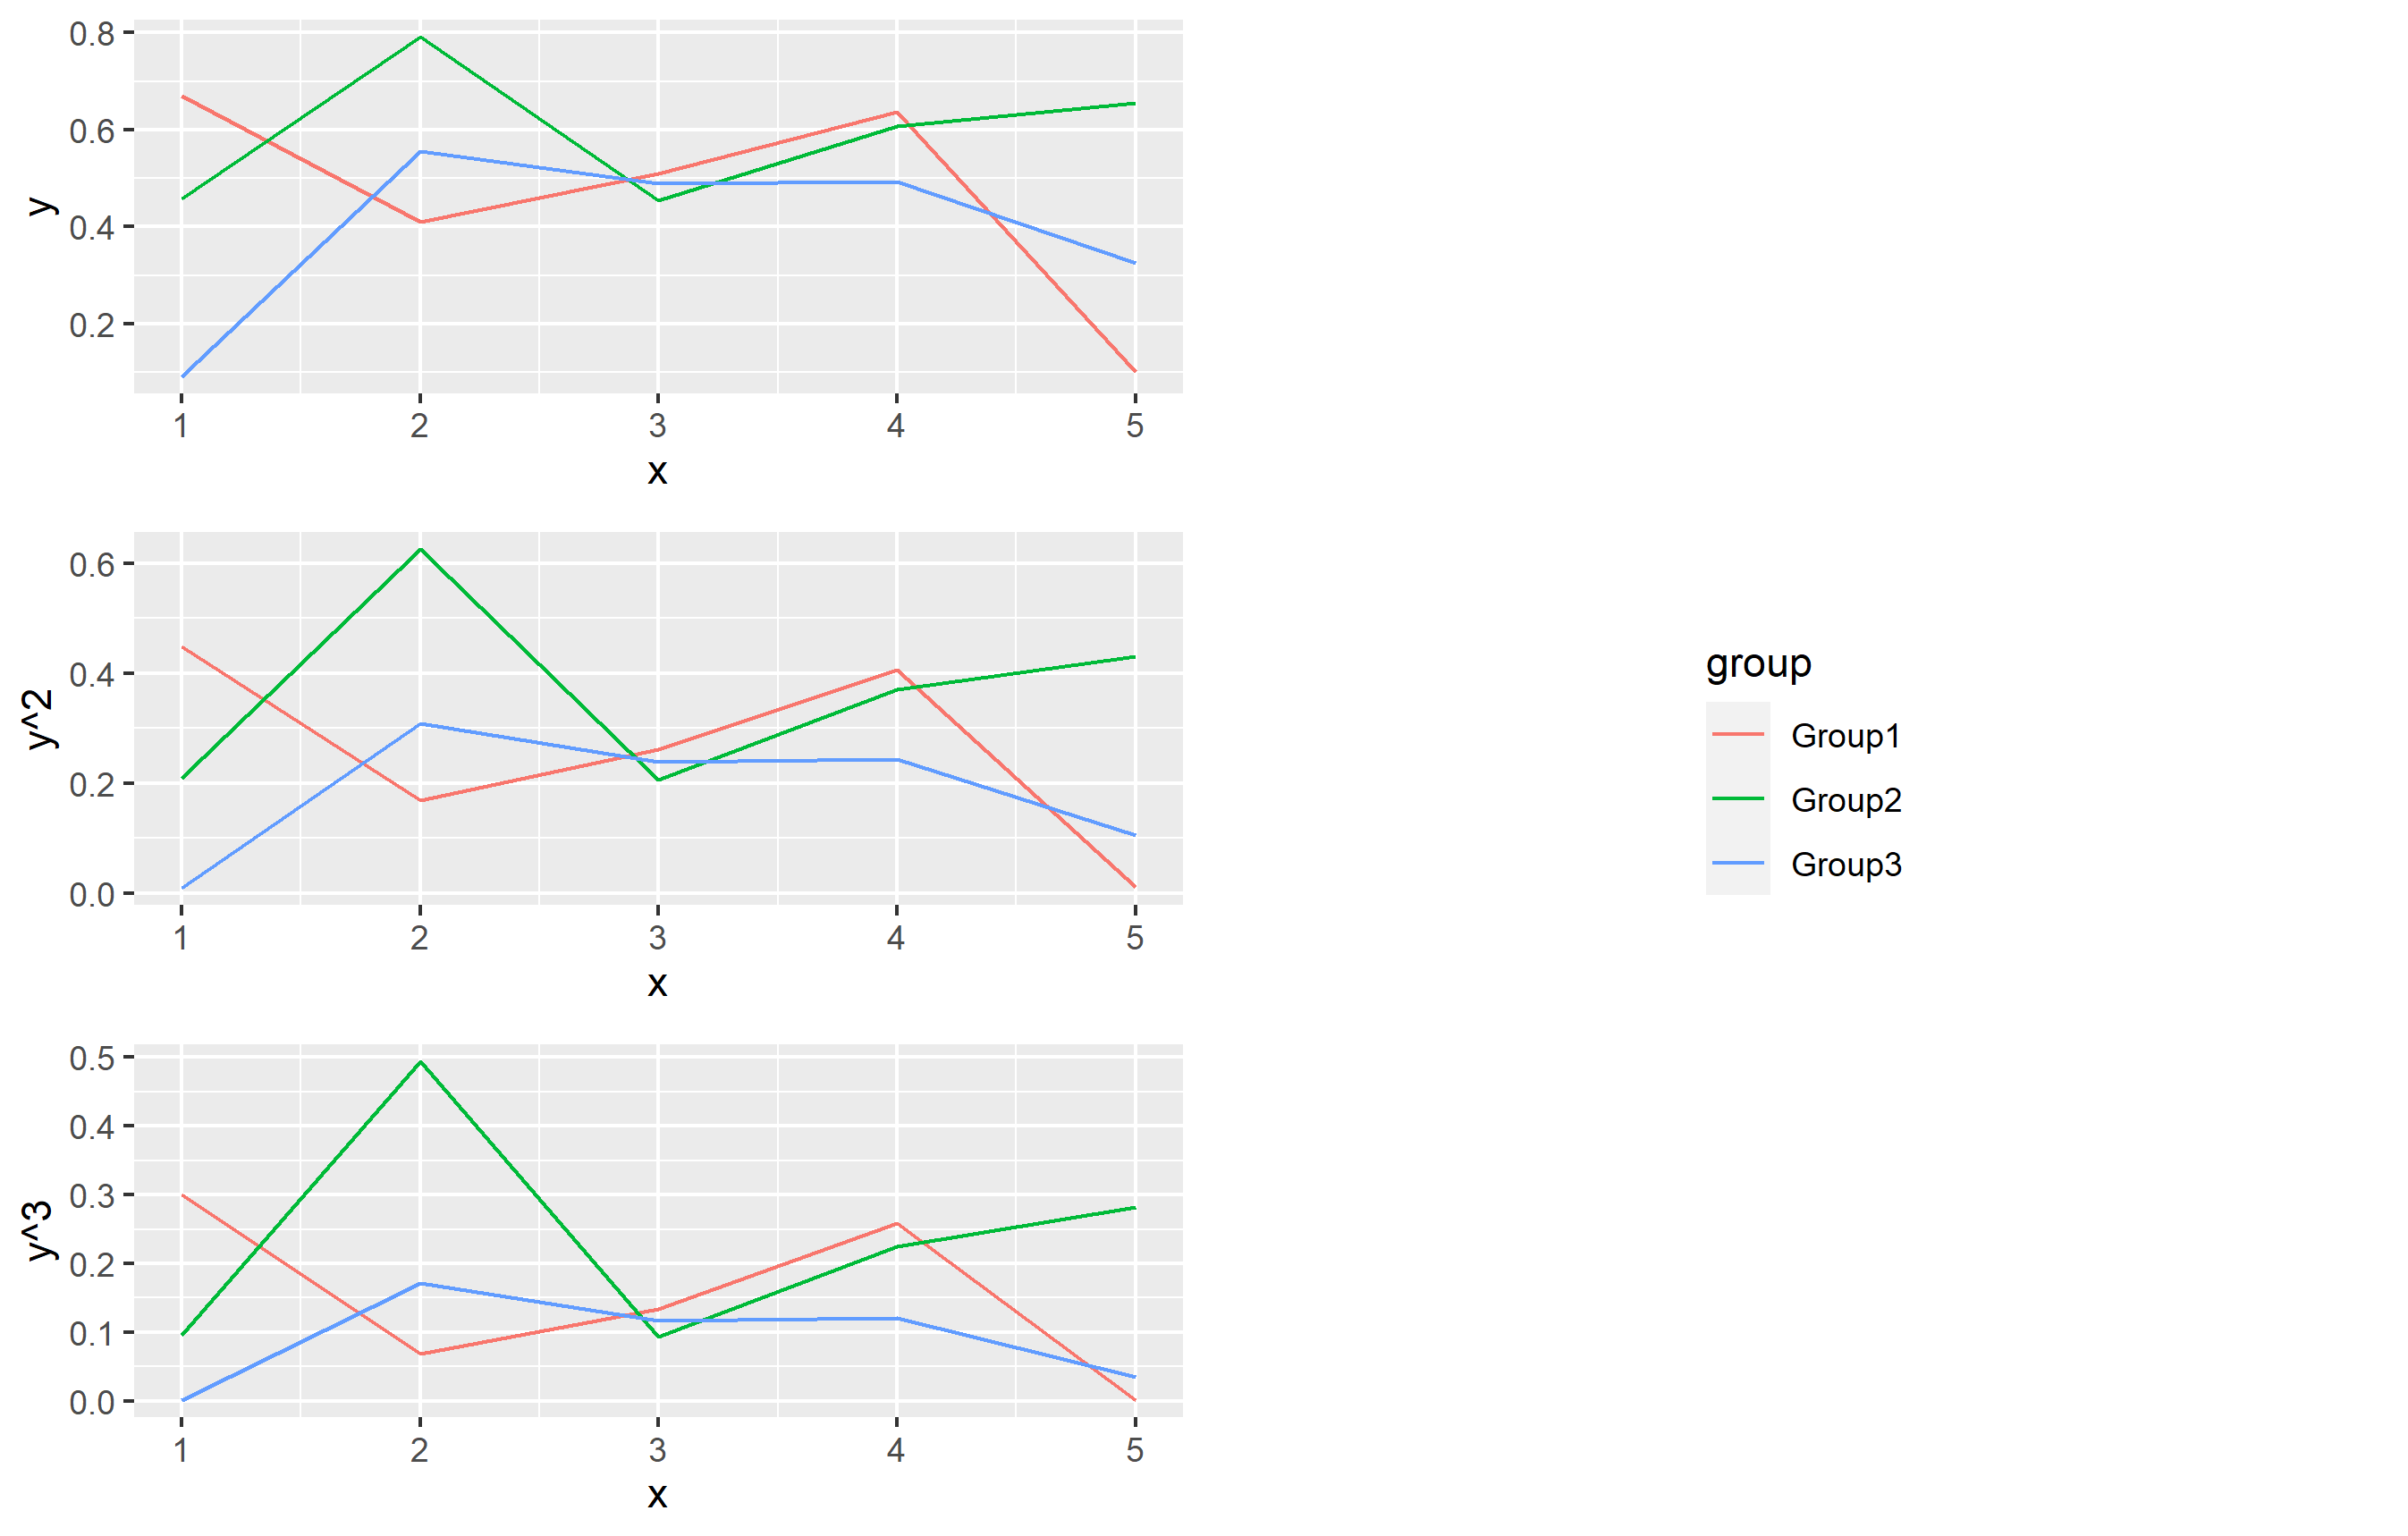
범례가 차지하는 공간이 너무 크기 때문에, layout matrix를 사용하여 크기를 적절히 조절해준다.

물론 위에서 정의한 g_legend에서 범례의 position 조절과 grid.arrange 값 조절을 통해
범례를 위, 아래, 왼쪽에 둘 수도 있다.
예시 )
g_legend<-ggplot(data=df)+
  geom_line(aes(x=x, y=y, group = group, color = group))+
  theme(legend.position = "bottom") #right→bottom

CommonLegend<-get_only_legend(g_legend)

g<-grid.arrange(g1, g2, g3, ncol=3) #nrow→ncol

#ncol→nrow
G<-grid.arrange(g, CommonLegend, nrow=2, layout_matrix = rbind(1, 1, 1, 1, 2))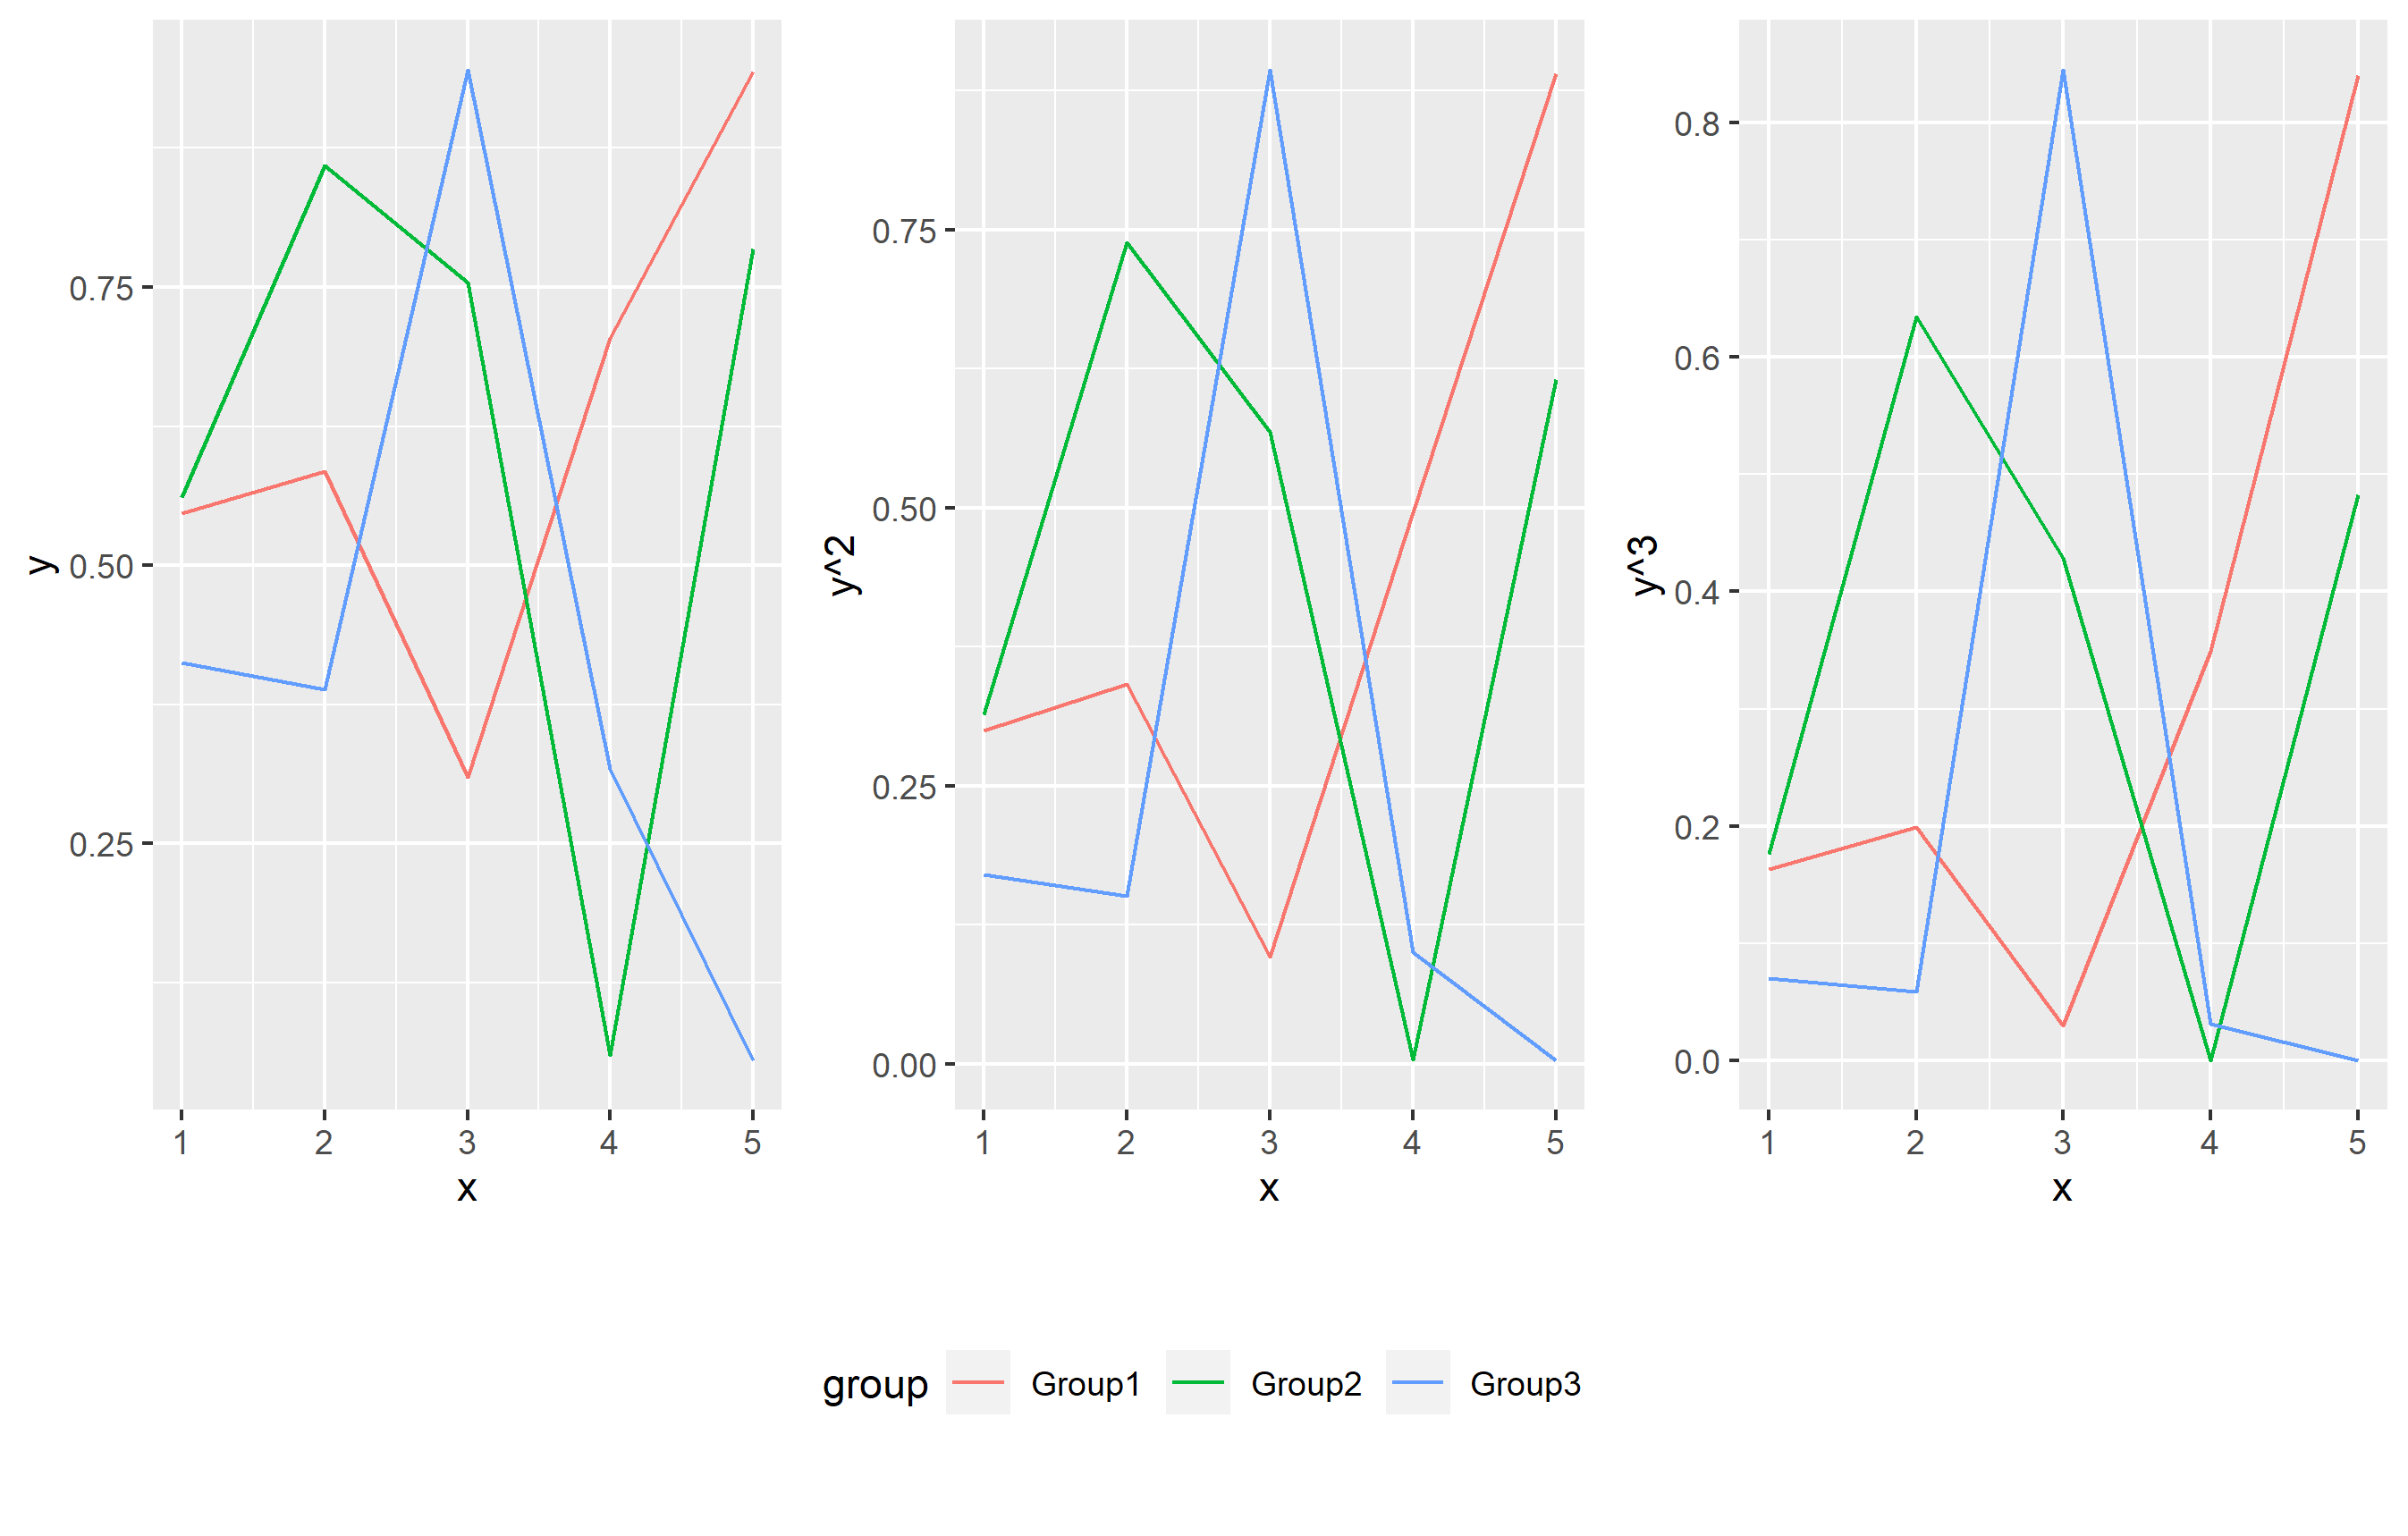
짠 ^^
출처
https://origin.geeksforgeeks.org/add-common-legend-to-combined-ggplot2-plots-in-r/amp/