
기억보다 기록을
GGPLOT2 - textgrob 사용하기 (합쳐진 그림에 라벨 넣기) 본문
library(gridExtra)
library(grid)
library(gridtext)

df<-data.frame(x1=runif(5),
               x2=runif(5),
               x3=runif(5),
               x4=runif(5),
               y=runif(5))

p1 <- ggplot(data = df, aes(x = x1, y = y))+geom_line()
p2 <- ggplot(data = df, aes(x = x2, y = y))+geom_line()
p3 <- ggplot(data = df, aes(x = x3, y = y))+geom_line()
p4 <- ggplot(data = df, aes(x = x4, y = y))+geom_line()

p = list(p1,p2,p3,p4)
grid.arrange(grobs=p, ncol = 2, nrow = 2)
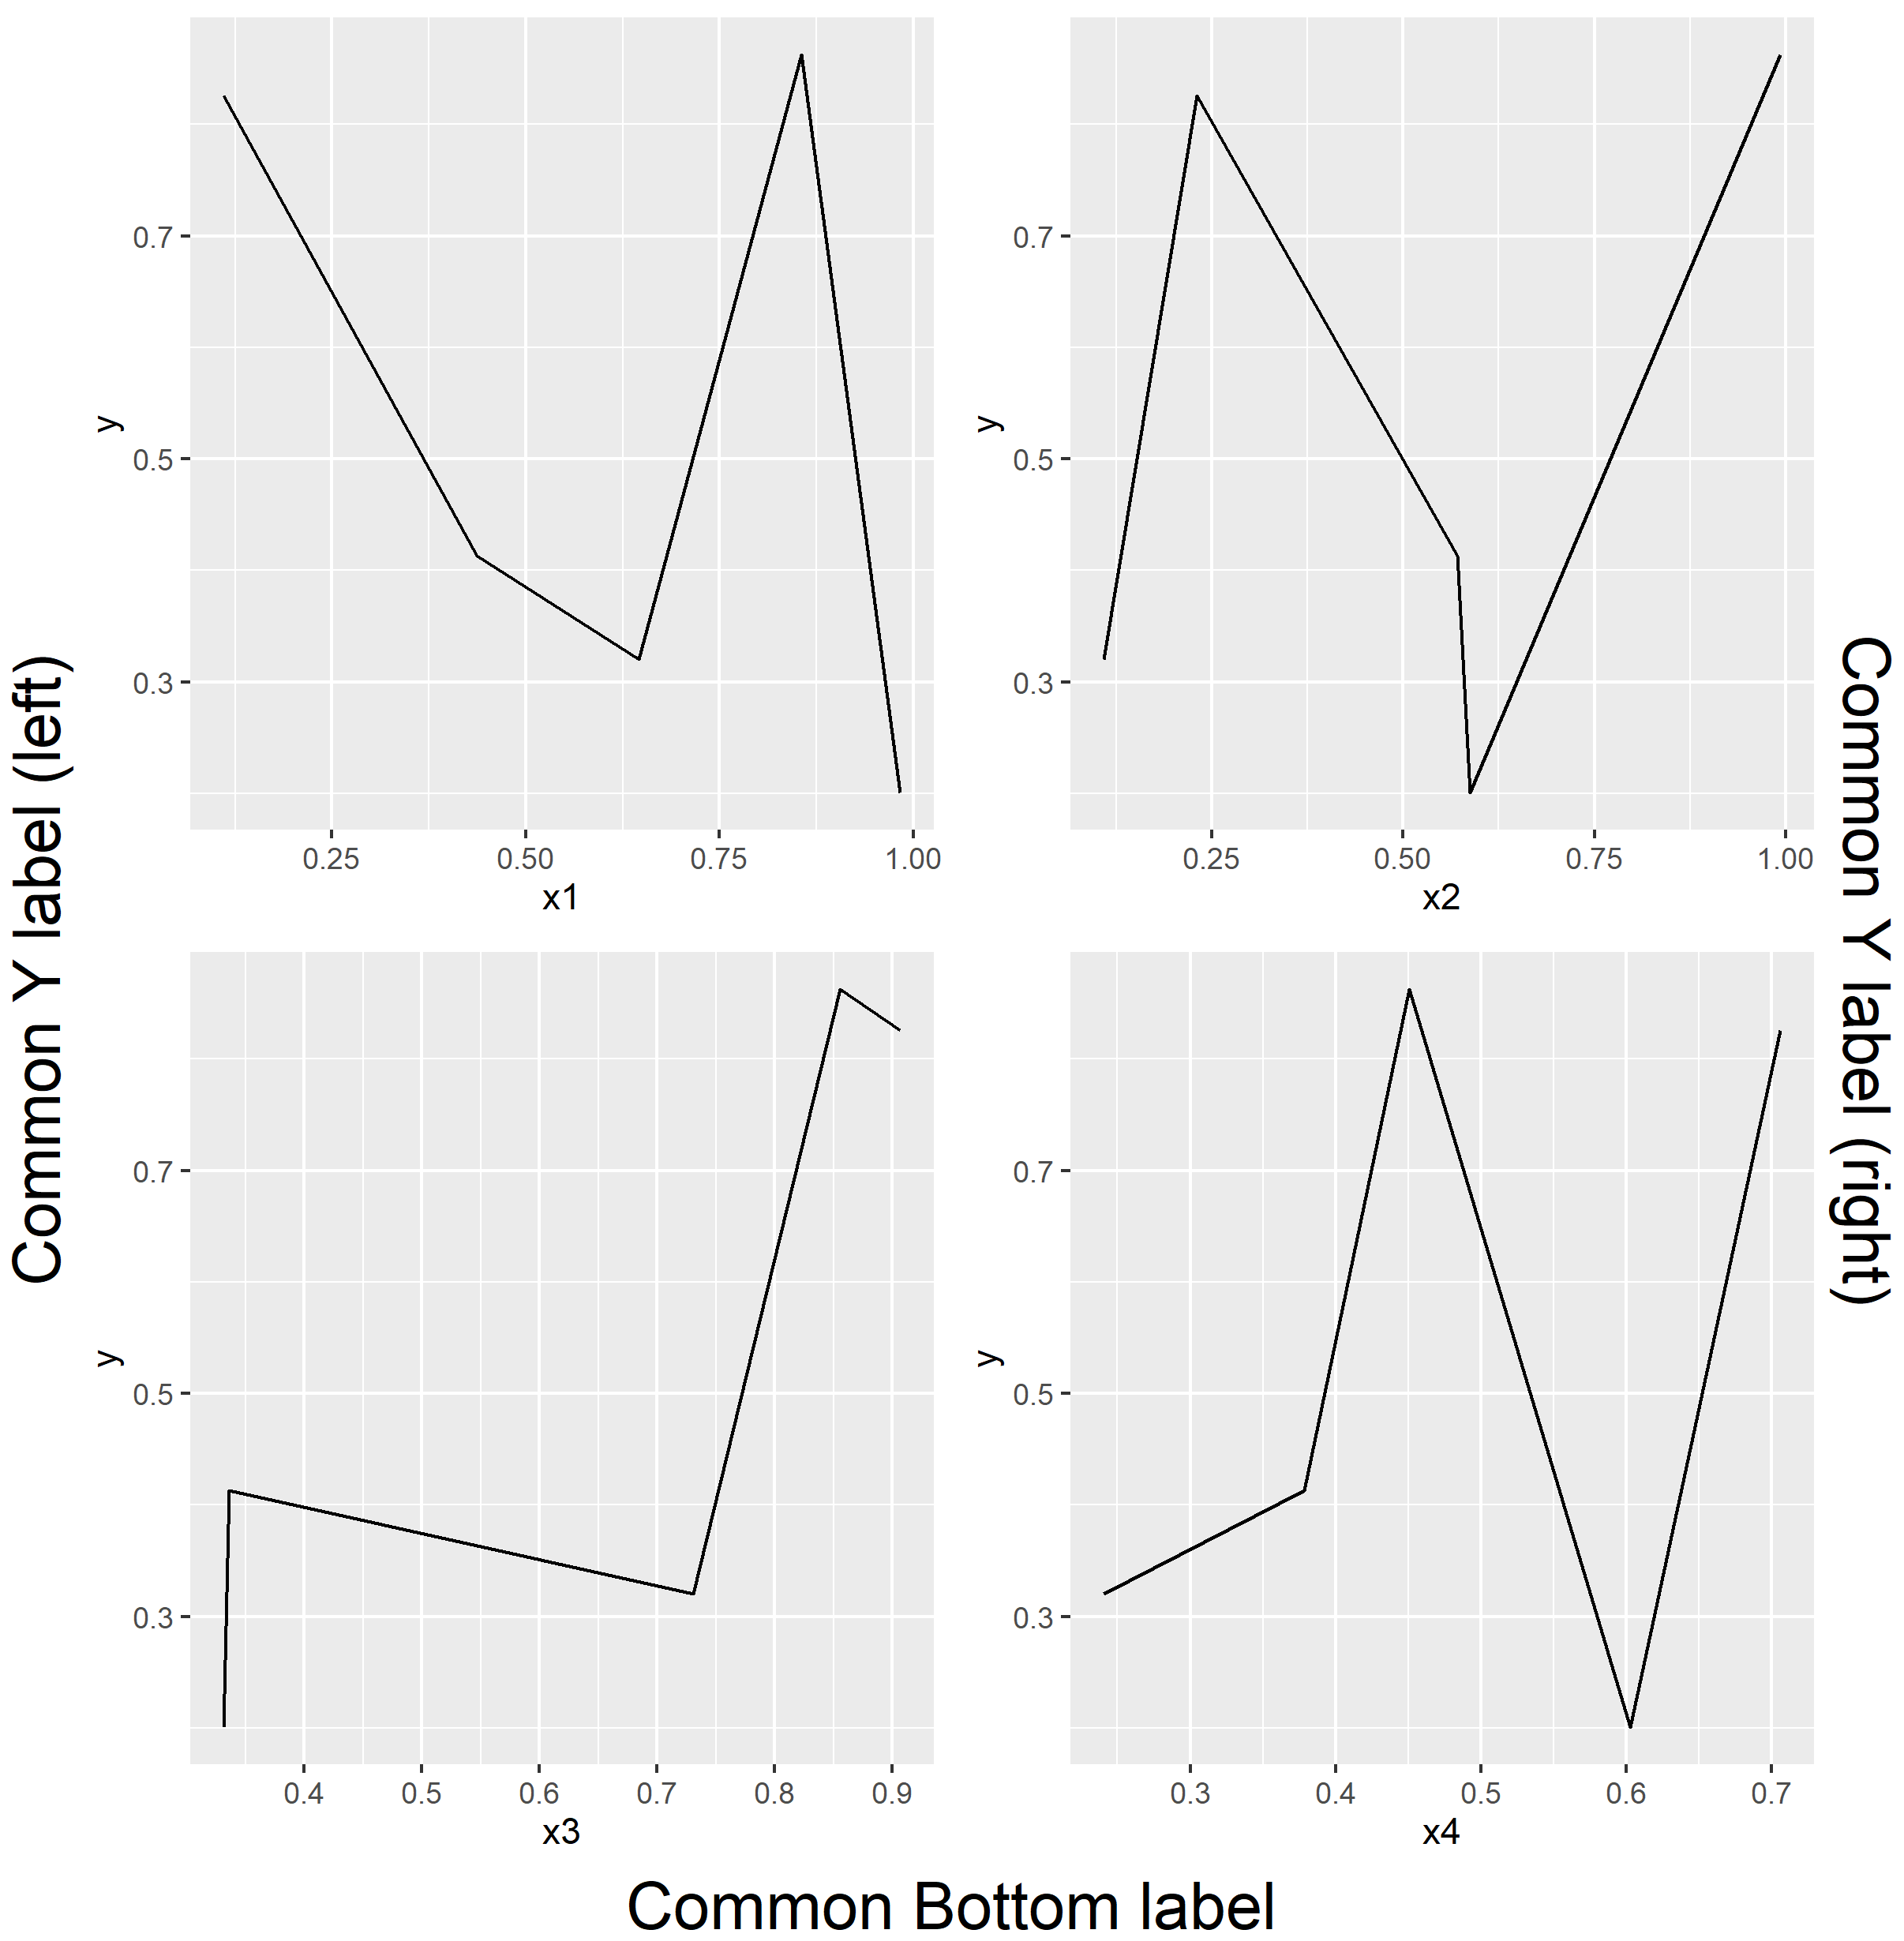
위와 같이 4개의 그림을 하나로 합친 그림에 대해, 공통 라벨을 붙이는 방법 : textgrob를 사용한다
yleft <- textGrob("Common Y label (left)",
                  rot = 90,
                  gp = gpar(fontsize = 20))

yright <- textGrob("Common Y label (right)",
                   rot = 270,
                   gp = gpar(fontsize = 20))

bottom <- textGrob("Common Bottom label",
                   gp = gpar(fontsize = 20))

grid.arrange(grobs=p, ncol = 2, nrow = 2, left = yleft, right = yright, bottom = bottom)
짠
참고 자료 : https://cran.r-project.org/web/packages/gridExtra/vignettes/arrangeGrob.html
'R' 카테고리의 다른 글
| GGPLOT2 - geom_line에 point 추가하기 (0) | 2022.02.14 |
|---|---|
| GGPLOT2 - 합쳐진 그림에 대해 공통 범례 붙이기 (0) | 2022.02.02 |
| GGPLOT2 - geom_map (한국 지도 그림 그리기) (0) | 2022.01.08 |
| GGPLOT2 - geom_histogram (히스토그램) (0) | 2022.01.06 |
| GGPLOT2 - geom_boxplot 사용하기 (상자 그림) (0) | 2022.01.06 |
'R' Related Articles
more


