
개인공부기록용
MissForest 사용하기 (결측치 보간법) 본문
MissForest는 RandomForest 기반의, 결측치 대체 기법 중 하나이다.
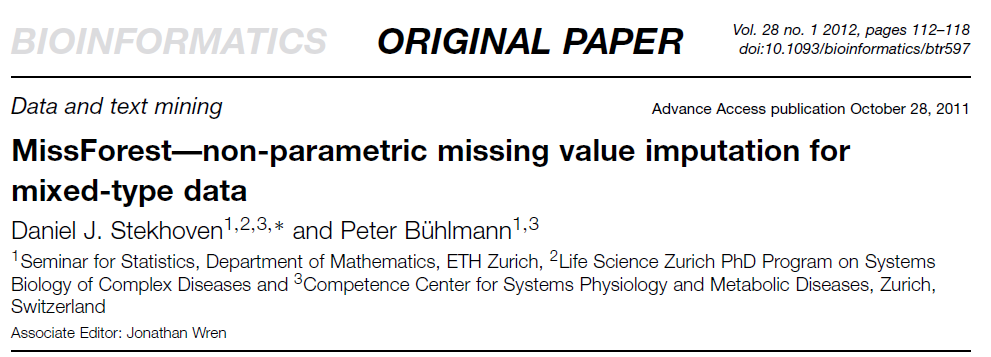
특징으로는,
1. 수치형, 범주형 변수들이 섞여있는 데이터셋에서도 별도의 전처리 없이 동시 처리가 가능하다
2. 비모수적 특성을 지니기 때문에 데이터가 특정 분포를 따르는지에 대한 여부를 몰라도 사용이 가능하다
3. 트리 기반의 모델이기 때문에 이상치의 영향을 적게 받는다 (Robustness)
의료 데이터처럼 소규모 데이터셋을 다루거나,
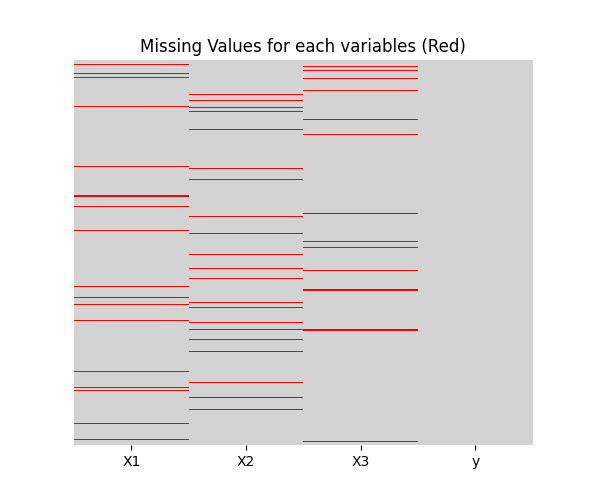
혹은 결측치가 아래처럼 irregular하게 존재하는 경우 사용하면 좋다 (특정 변수들의 일부분 데이터가 비어있을 때).
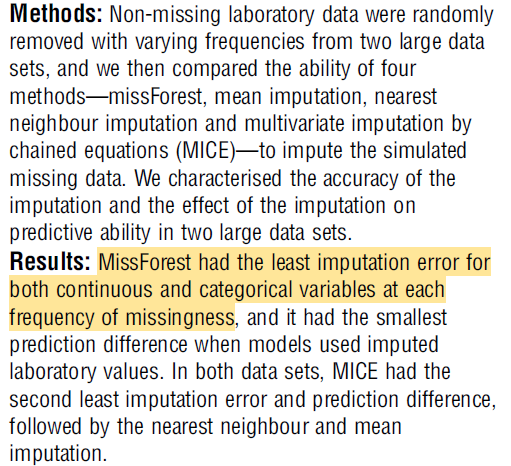
아래의 논문은 의료 데이터에서 결측치를 다룰 때 쓰이는 여러 기법들의 performance를 비교한 논문인데,
MissForest가 가장 성능이 좋다고 평가했다.

감사하게도 Python에 MissForest 패키지가 있는데, 토이 데이터로 간단하게 실습을 해보자.
입력값이 \( X_1, X_2,X_3\) 이고 출력값이 \(Y\)인 데이터셋이 아래의 형태를 따른다고 하자.
$$ Y = 2X_1 + 3X_2^2 -X_3 $$
임의로 각 입력값에서 5% 정도 결측치를 넣고, 기존 데이터를 사용해서 MissForest로 보간을 해보자.
1. 패키지 로드
import numpy as np
import pandas as pd
import matplotlib.pyplot as plt
import seaborn as sns
from missforest import MissForest
from sklearn.metrics import mean_squared_error, mean_absolute_error, r2_score
2. 입력값, 출력값 생성
np.random.seed(42)
n_samples = 500
X = np.random.rand(n_samples, 3)
y = (2 * X[:, 0] + 3 * (X[:, 1]**2) - X[:, 2]).reshape(-1, 1

cols = ['X1', 'X2', 'X3', 'y']
df_true = pd.DataFrame(np.hstack([X, y]), columns=cols)
3. 각 입력값에서 임의로 결측치 생성
df_missing = df_true.copy()
mask = pd.DataFrame(False, index=df_true.index, columns=df_true.columns)
for col in ['X1', 'X2', 'X3']:
    idx = np.random.choice(df_true.index, size=int(n_samples * 0.05), replace=False)
    df_missing.loc[idx, col] = np.nan
    mask.loc[idx, col] = True

plt.figure(figsize=(8, 5))
sns.heatmap(df_missing.isnull(), yticklabels=False, cbar=False, cmap=['lightgrey', 'red'])
plt.title("Missing Values Heatmap (Red: Missing, Light Grey: Present)")
plt.show()
4. MissForest 사용하여 결측치 보간
mf = MissForest()
df_imputed = mf.fit_transform(df_missing)
5. 실제 값과 보간된 값 시각화
comparison = []
for col in ['X1', 'X2', 'X3']:
    m = mask[col]
    for t, i in zip(df_true.loc[m, col], df_imputed.loc[m, col]):
        comparison.append({'Variable': col, 'True': t, 'Imputed': i, 'Abs_Error': abs(t - i)})
df_res = pd.DataFrame(comparison)
plt.figure(figsize=(12, 5))
sns.scatterplot(data=df_res, x='True', y='Imputed', hue='Variable', s=100)
plt.plot([0, 1], [0, 1], 'r--', alpha=0.5, label='Perfect')
plt.title('True vs Imputed Distribution')
plt.legend()
plt.tight_layout()
plt.show()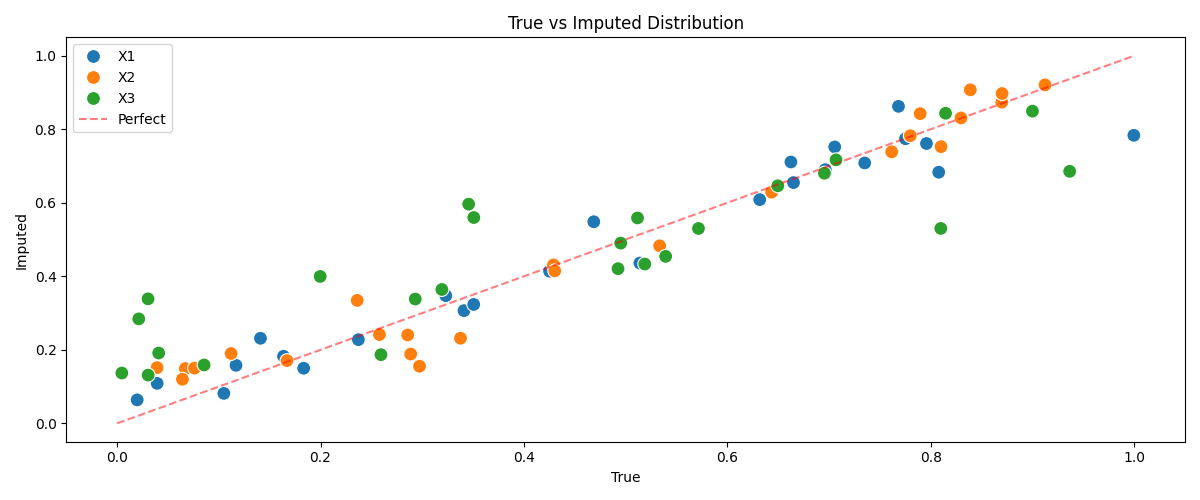
라인 근처에 걸쳐있으면 아주 보간이 잘 된것을 의미한다.
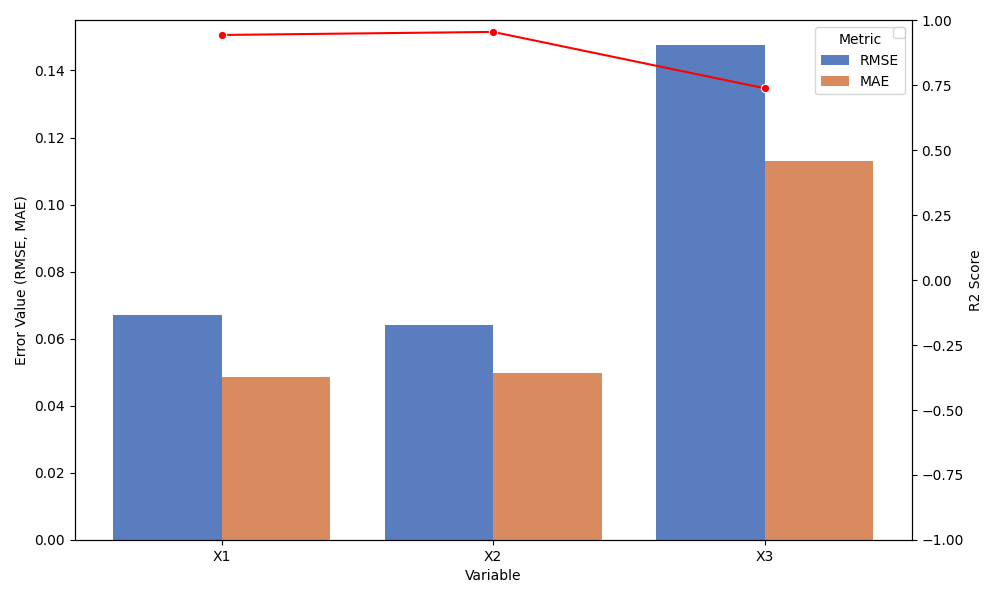
6. 성능 평가 (RMSE, MAE, 결정계수 \( R^2\)) 및 시각화
metrics_list = []

for col in ['X1', 'X2', 'X3']:
    m = mask[col]
    true = df_true.loc[m, col]
    pred = df_imputed.loc[m, col]

    rmse = np.sqrt(mean_squared_error(true, pred))
    mae = mean_absolute_error(true, pred)
    r2 = r2_score(true, pred)

    metrics_list.append({'Variable': col, 'RMSE': rmse, 'MAE': mae, 'R2': r2})

df_metrics = pd.DataFrame(metrics_list)
fig, ax1 = plt.subplots(figsize=(10, 6))
df_melted = df_metrics.melt(id_vars='Variable', value_vars=['RMSE', 'MAE'], var_name='Metric', value_name='Value')
sns.barplot(data=df_melted, x='Variable', y='Value', hue='Metric', ax=ax1, palette='muted')
ax1.set_ylabel('Error Value (RMSE, MAE)')
ax2 = ax1.twinx()
sns.lineplot(data=df_metrics, x='Variable', y='R2', marker='o', color='red', ax=ax2)
ax2.set_ylabel('R2 Score')
ax2.set_ylim(-1, 1) # R2 범위 설정
ax2.legend(loc='upper right')
plt.tight_layout()
plt.show()

참고문헌
1. Daniel J. Stekhoven, Peter Bühlmann, MissForest—non-parametric missing value imputation for mixed-type data, Bioinformatics, Volume 28, Issue 1, January 2012, Pages 112–118, https://doi.org/10.1093/bioinformatics/btr597
MissForest—non-parametric missing value imputation for mixed-type data
Abstract. Motivation: Modern data acquisition based on high-throughput technology is often facing the problem of missing data. Algorithms commonly used in
academic.oup.com
2. Waljee, A. K., Mukherjee, A., Singal, A. G., Zhang, Y., Warren, J., Balis, U., Marrero, J., Zhu, J., & Higgins, P. D. (2013). Comparison of imputation methods for missing laboratory data in medicine. BMJ open, 3(8), e002847. https://doi.org/10.1136/bmjopen-2013-002847

